Oral health data dashboards
14 interactive dashboards by Sakhr A. Murshid Al-Kubati, PhD, built in Tableau Public from published oral-health data: how common tooth decay, malocclusion, cleft palate and jaw joint disorders are around the world, how much sugar countries consume, and how many dentists there are, who they are and where they work.
How to read these: each dashboard shows the figures from the source it names, which may come from different years and study methods, so differences between countries are not always directly comparable. Previews are still images; open a dashboard to explore and filter the data.
Featured
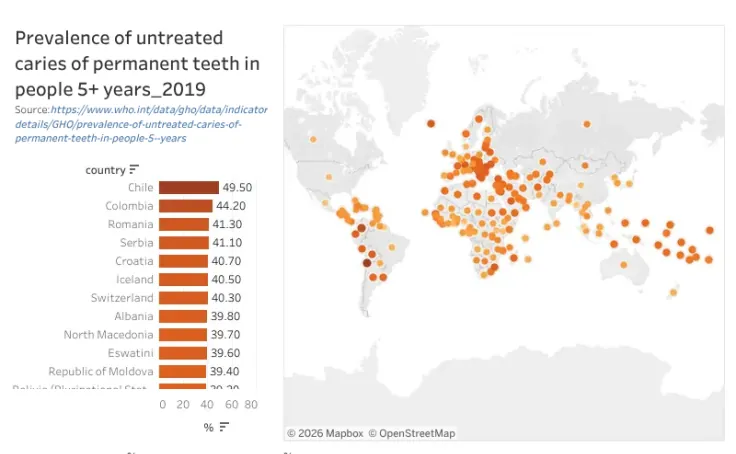
Prevalence of untreated caries of permanent teeth in people 5+ years (2019)
A world map and country ranking of the share of people aged 5 and over with untreated tooth decay in their permanent teeth.
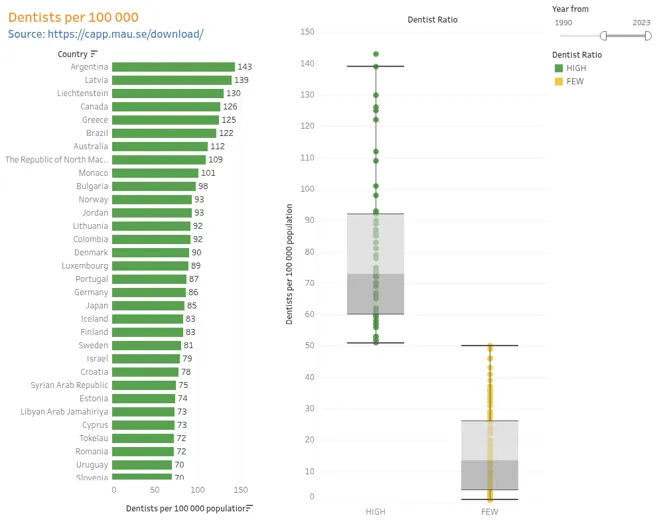
Dentists per 100,000 population
Dentist density by country, with a box plot that contrasts countries with many dentists per person and countries with few.
Oral diseases and conditions
Prevalence of untreated caries of permanent teeth in people 5+ years (2019)
A world map and country ranking of the share of people aged 5 and over with untreated tooth decay in their permanent teeth.
Data source named on the dashboard: WHO Global Health Observatory
Published on Tableau Public 2024-07 · Open interactive dashboard ↗
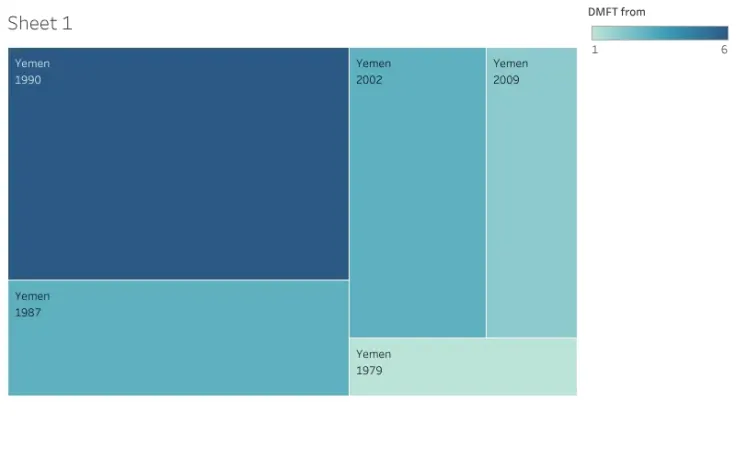
DMFT in Yemen
DMFT scores (the number of decayed, missing and filled teeth) reported for Yemen in different survey years between 1979 and 2009.
Published on Tableau Public 2024-10 · Open interactive dashboard ↗
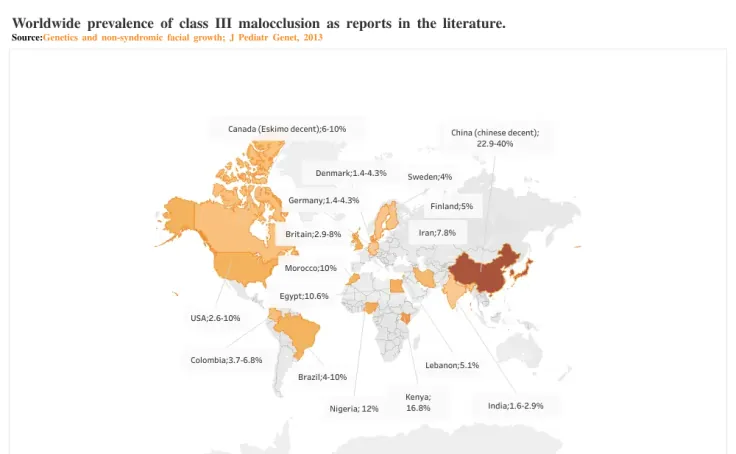
Worldwide prevalence of class III malocclusion
A world map of class III malocclusion (where the lower jaw sits forward, as in an underbite), as reported in the literature for selected countries and populations.
Data source named on the dashboard: Genetics and non-syndromic facial growth, J Pediatr Genet, 2013
Published on Tableau Public 2024-11 · Open interactive dashboard ↗
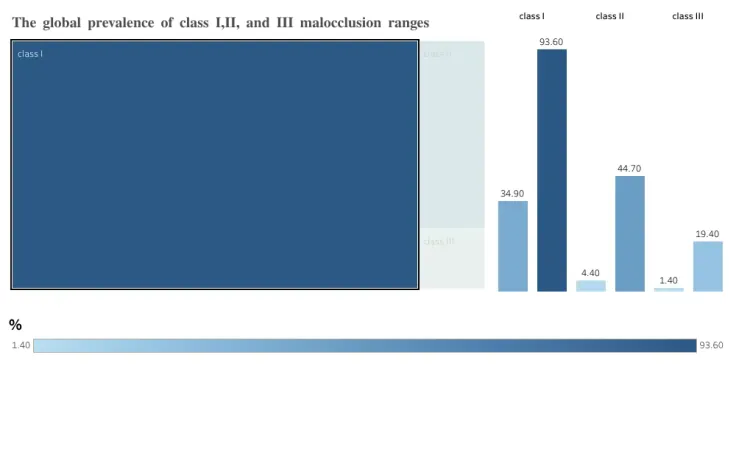
The global prevalence of class I, II and III malocclusion ranges
Compares the lowest and highest reported global prevalence of Angle class I, II and III malocclusion.
Published on Tableau Public 2024-10 · Open interactive dashboard ↗
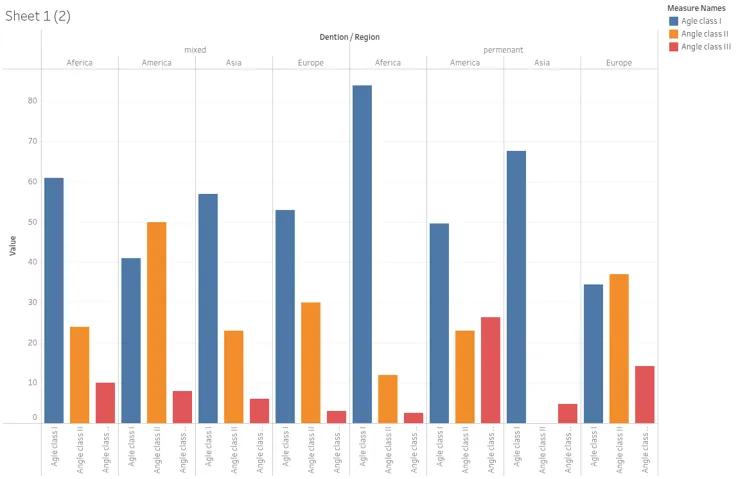
Angle classification in mixed and permanent dentition
The share of Angle class I, II and III malocclusion in children's mixed dentition and in permanent dentition, by region (Africa, America, Asia and Europe).
Published on Tableau Public 2024-07 · Open interactive dashboard ↗
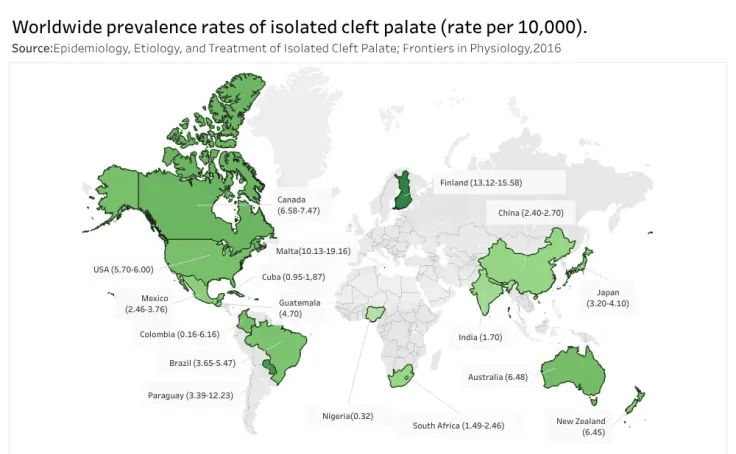
Worldwide prevalence rates of isolated cleft palate (rate per 10,000)
A world map of reported prevalence rates of isolated cleft palate, per 10,000, by country.
Data source named on the dashboard: Epidemiology, Etiology, and Treatment of Isolated Cleft Palate, Frontiers in Physiology, 2016
Published on Tableau Public 2024-11 · Open interactive dashboard ↗
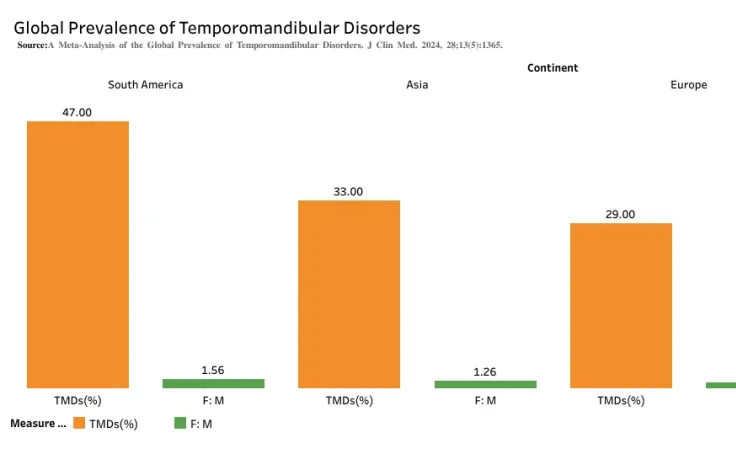
Global prevalence of temporomandibular disorders
The prevalence of temporomandibular disorders (jaw joint and jaw muscle problems) by continent, with the female-to-male ratio.
Data source named on the dashboard: A Meta-Analysis of the Global Prevalence of Temporomandibular Disorders, J Clin Med, 2024
Published on Tableau Public 2024-11 · Open interactive dashboard ↗
Risk factors
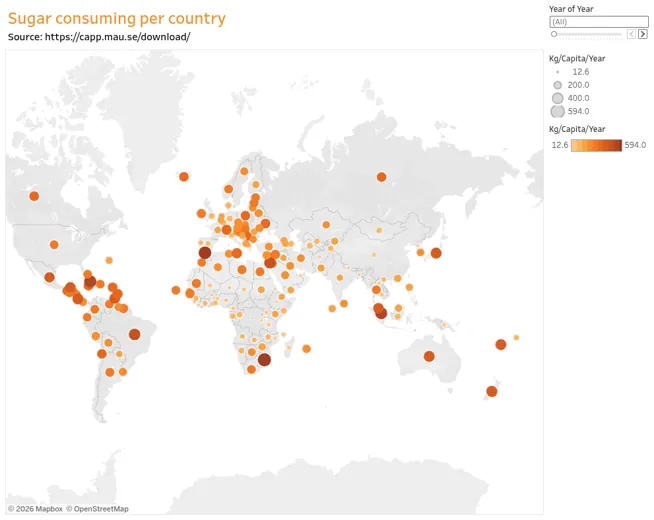
Sugar consumption per country
A world map of sugar consumption in kilograms per person per year, with a year filter. Sugar is a main dietary cause of tooth decay.
Data source named on the dashboard: Malmö University oral health database (capp.mau.se)
Published on Tableau Public 2024-05 · Open interactive dashboard ↗
Related: sleep and the mouth
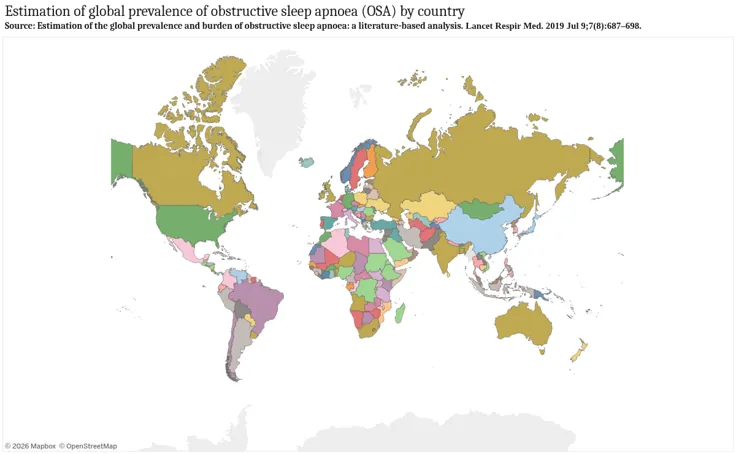
Estimated global prevalence of obstructive sleep apnoea by country
A world map of estimated obstructive sleep apnoea prevalence, country by country. Obstructive sleep apnoea is a sleep-related breathing disorder rather than a mouth disease, but dentists help treat it with oral appliances that hold the lower jaw forward during sleep.
Data source named on the dashboard: Estimation of the global prevalence and burden of obstructive sleep apnoea: a literature-based analysis, Lancet Respir Med, 2019
Published on Tableau Public 2024-11 · Open interactive dashboard ↗
The dental workforce
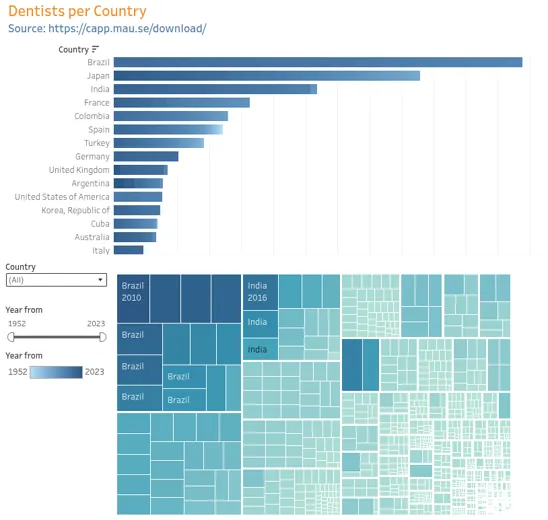
Dentists by country
The number of dentists by country, shown as a ranked bar chart and a treemap, with country and year filters.
Data source named on the dashboard: Malmö University oral health database (capp.mau.se)
Published on Tableau Public 2024-05 · Open interactive dashboard ↗
Dentists per 100,000 population
Dentist density by country, with a box plot that contrasts countries with many dentists per person and countries with few.
Data source named on the dashboard: Malmö University oral health database (capp.mau.se)
Published on Tableau Public 2024-05 · Open interactive dashboard ↗
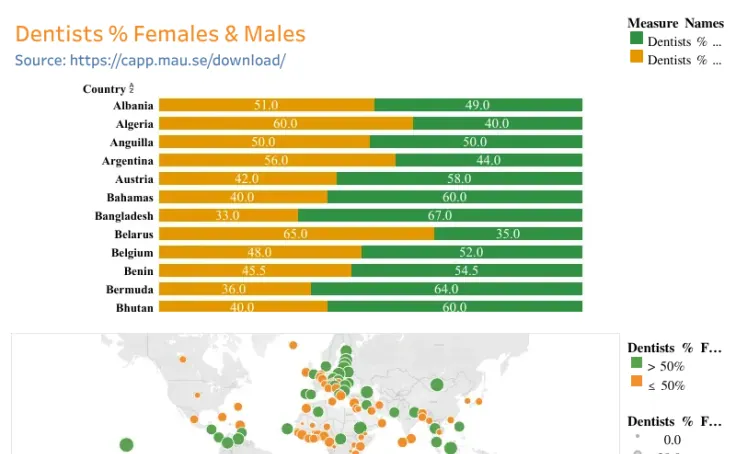
Dentists: percentage of women and men
The share of female and male dentists in each country, as a map and a bar chart.
Data source named on the dashboard: Malmö University oral health database (capp.mau.se)
Published on Tableau Public 2024-06 · Open interactive dashboard ↗
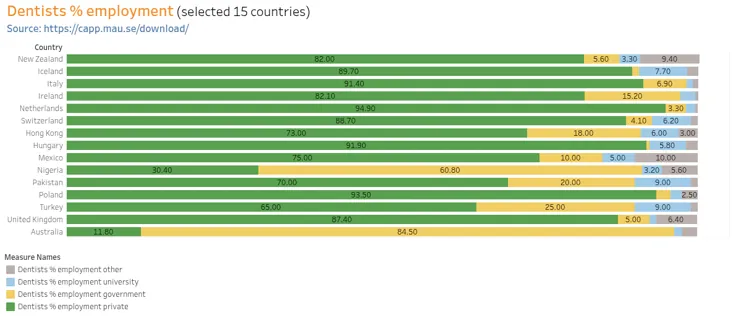
Where dentists work (15 selected countries)
The share of dentists working in private practice, government service, universities and other settings in 15 countries.
Data source named on the dashboard: Malmö University oral health database (capp.mau.se)
Published on Tableau Public 2024-05 · Open interactive dashboard ↗
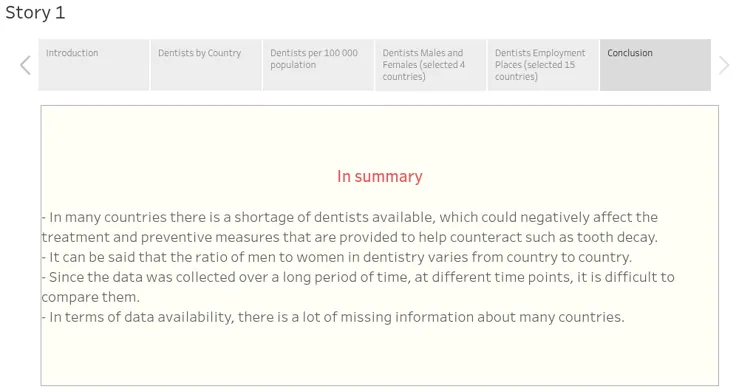
Dentists by country, per population, gender and place of work (story)
A step-by-step Tableau story that brings the workforce dashboards together and ends with a short summary. Its summary notes that the data were collected at different times and many countries have gaps, so comparisons need care.
Published on Tableau Public 2024-05 · Open interactive dashboard ↗
More of Sakhr's work, including bibliometric dashboards on 3D cell culture research, is on his Tableau Public profile. Dashboard list checked 2026-10-21.